Coco 📕@lemmygrad.ml to Shit Reactionaries Say@lemmygrad.mlEnglish · 18 days ago“MuH WhItE G3n0c!de!”lemmygrad.mlimagemessage-square17fedilinkarrow-up10arrow-down10file-text
arrow-up10arrow-down1image“MuH WhItE G3n0c!de!”lemmygrad.mlCoco 📕@lemmygrad.ml to Shit Reactionaries Say@lemmygrad.mlEnglish · 18 days agomessage-square17fedilinkfile-text
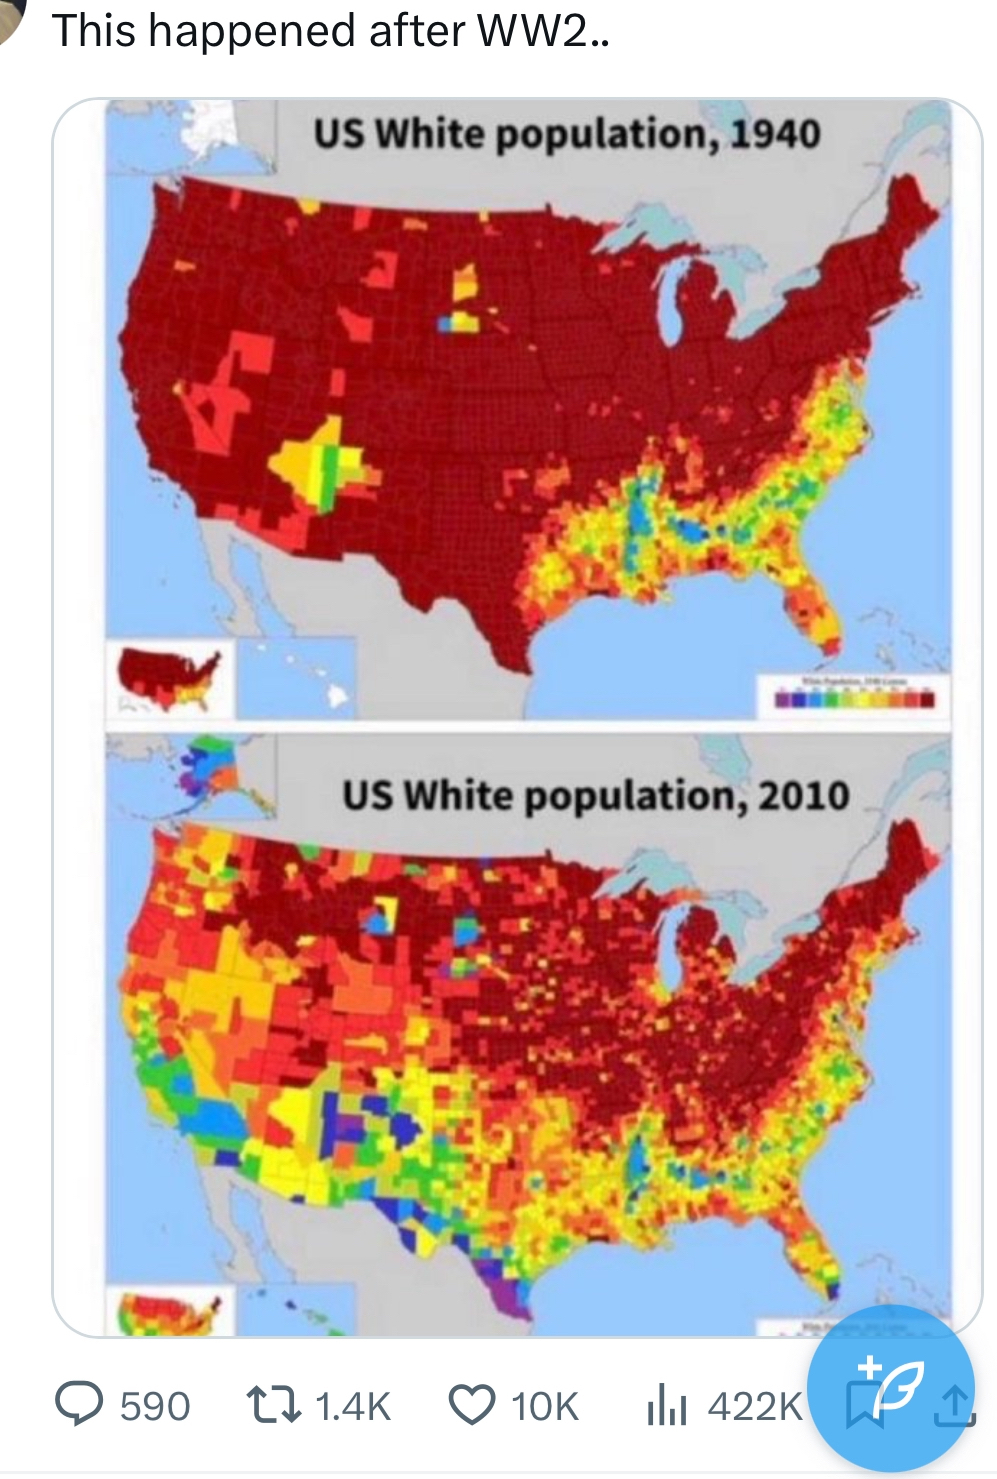
minus-squarecollapse_already@lemmy.mllinkfedilinkEnglisharrow-up0·17 days agoThe chart must be using percentages or something because for example, Texas had about 5.4M whites in 1940 and 11.4M whites in 2010. Doesn’t look like a decline to me.


The chart must be using percentages or something because for example, Texas had about 5.4M whites in 1940 and 11.4M whites in 2010. Doesn’t look like a decline to me.