

I don’t think there is an earlier option for less money anymore but could be wrong.
men’s life expectancy is only 77 now
That figure is average life expectancy. IE 50% of US man are expected to reach 77.
A bit of history on why 65 was originally set as the retirement age.
The first country to set retirement at 65 was the Weimar Republic in Germany (1918-1933).
The reason 65 was chosen was that at that time only 5% (1 in 20) of the German population made it to 65. Retirement and the pension was a case of “You have worked hard all you life and will die soon, this is to let your final years be a bit easy”
Over the last century, in the west at least, over average lifespan has increased markedly and the quality of life for people of advanced age has also increased.
Many government now face the issue that they cannot afford to keep paying retirement benefits for two reasons:
1: Many many more people are reaching retirement age and they are living for decades more, rather than a few years.
2: With the decline in birthrates the ratio of working people to those in retirement has changed from about 10 to 1 to about 5 to 1 and is expected to get worse in the decades to come.
This does not answer your question but gives you an idea of the issues and hard decisions societies will have to face in the coming decades.
That figure is average life expectancy. IE 50% of US man are expected to reach 77.
I can’t access the full paper that this is in reference too, so I’m not sure how they calculate it… but isn’t life expectancy usually the mean age of death? I would expect the distribution to have a left skew from people who die young, which should mean that more than 50% of US men are expected to reach 77.
Take a life table, check the column that says lx, that means how many people of the model are alive with x years, normally l_0 = 10000. Then go down until you found lx = 5000 or lx = 1/2 l_0, that x is your life expectancy at birth. If you want to know the life expectancy at any age, look for the value of lx at that age, then look in how many years that value half, that’s the expectancy. Source: I’m an actuarie and study that in college, but don’t ask me to go deeper because I don’t use that at my job.I was wrong.
That marks the median age of death, but I don’t think that’s the definition of life expectancy (though maybe the term is used loosely or imprecisely to mean the median age of death or the average age of death). The definitions of life expectancy I found claim it’s the mean age of death, which would make sense because the expected value of a random variable is the arithmetic mean. That said, the median on the life tables that I have found seem to correlate much more closely to the age of 77 versus the life expectancy at birth which is much lower (78-79 for the median and 74 for the life expectancy at birth for 2020 data)… but the actual paper is behind a pay wall so I have no idea what they’re actually computing for 77 years of life expectancy… my guess is that it’s the median and not the mean, but maybe they’re considering people over a certain age or something… either way, the mean / median getting confused is an issue and I wish people were more clear about what metric is actually being communicated.
Okay, I couldn’t look at this table when I responded last night (I thought you were referring to the zip files, not the PDFs at the bottom). Got a chance to look at them on my computer today!
Would you call the point where I_x = 1/2 I_0 the life expectancy at birth? In the life tables you link to (direct link to the 2020 table) there’s an “expectation of life at age x” column which differs! My understanding is that in official metrics of “life expectancy” they usually mean the “life expectancy at birth”, which is calculated in the “expectation of life at age x” column in this data set, do actuaries use a different definition?
In this table “life expectancy at birth” is estimated at 74.2 for men in the USA in 2020. This is calculated in this table by computing T_0 / I_0, which is the arithmetic mean for the ages of death in this period. The estimate for the median age of death in this table is between the ages of 79 and 80. There’s about a 5 year difference between these two numbers, and furthermore only about 40% of the population of men has died by the ages of 74-75 in this table, which is quite different from 50% if we assume “life expectancy” is this arithmetic mean. These are pretty big differences, and I really wish people / articles would be more clear about how the number they’re quoting was actually calculated and what it means! The estimated median age of death from the point I_x = 1/2 I_0 is a useful measure too, but I have no idea what a random person or article intends when they say “life expectancy” :|. I’ve grown to deeply distrust any aggregate measure that people discuss informally or in news articles… It’s often very unclear how that number was derived, what that number actually means in a mathematical sense, and if it even means anything at all.
I think im going crazy because I was sure that the ex was the easily calculated as I told before, but I just checked a couple of different mortality tables and the math doesn’t check out. I have no worked with life tables since college, but I’m going to ask my boss, that used to work with life insurance, about it tomorrow and follow up with his answer.
I just talked to my boss and he didn’t knew where the fuck I learned that because it had no sense. Maybe I saw some wicked up life tables where for some reason it worked like that. The formula is sum(i=x,w) l_i /l_x, that means (l_x + l_x+1 + … + l_w) / l_x, where w is the maximum life of the table.
average life expectancy
mean age of death?
To me mean = average, so the two statements are the same.
Are you talking about median age of death?
When child mortality was very high (pre- 20 century) that was definitely the case. I am not so sure that it is now. I feel that average life expectancy will be a lot closer to 50% survival rate (median age of death) than it was in the past.
To me mean = average, so the two statements are the same.
Are you talking about median age of death?
The median is the midpoint of a sample, not the mean. So, the median point represents the age where 50% of people will live to, the mean does not represent that (it’s often relatively close to the median assuming the data doesn’t have too much skew, but it can be way off).
When child mortality was very high (pre- 20 century) that was definitely the case. I am not so sure that it is now. I feel that average life expectancy will be a lot closer to 50% survival rate (median age of death) than it was in the past.
There are still plenty of people who die young, even though child mortality is less of a factor in wealthy countries right now. Plenty of people die in car accidents at a relatively young age, for instance. I’m sure the median and mean aren’t like 10 years off of each other, but I wouldn’t be surprised if they’re 3 or even 5 years off, which could be pretty significant in this context.
Well, both of us are making assumptions without doing the research.
So. I respect your opinion but neither of us knows that we are actually correct.
Well, the definition of the mean and median of a sample doesn’t depend on the particular data set, and there’s plenty of non-age related causes of death in the world which would logically skew the distribution to the left! You can look at actuarial tables to see this in action:
https://www.ssa.gov/oact/STATS/table4c6.html
Male life expectancy at birth in this table is 74.12, but you’ll notice that you don’t get to 50% of the population dying until somewhere between the ages of 78 and 79.
This website has a pretty good chart showing the skew for a 2019 dataset:
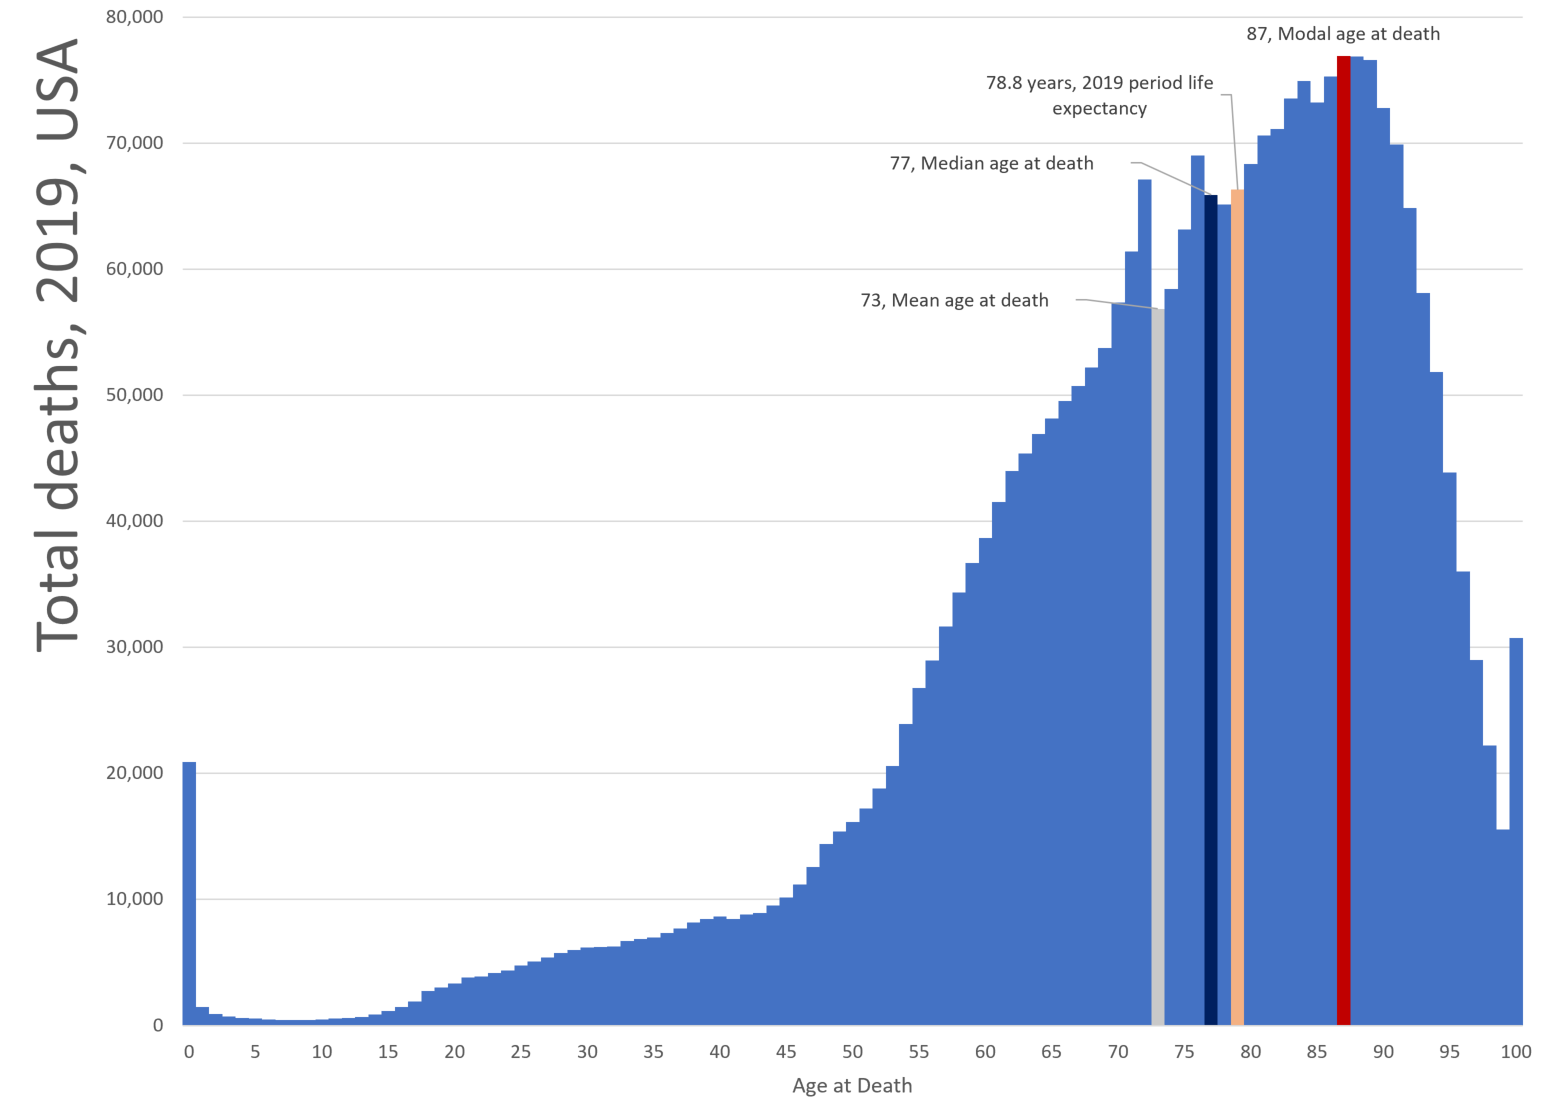
Social security will be bankrupt by 2033 according to their own estimates.
https://www.ssa.gov/OACT/TRSUM/index.html
Somehow they expect to pay 80% benefits beyond that point.
Expect your income taxes to go up…and by a lot.
deleted by creator
Removed by mod
Don’t watch kurzgesagt’s video on “South Korea”* getting older, if you don’t want to know the awful answer to that.
People will have and get social security paid. But the environment wars and mass immigration will be the answer, which means you’ll be looking at 20 years of conservatives bitching and whining.
Want to avoid it on a personal level? Emigrate to north europe. Sad, but it is what it is.
* video is more general than that. But they used korea as the clickbait.
There is an early option for less money.
You can start at 62 but you get twice as much if you wait until 70.
What a gamble.
I get $2,177 a month at 62, $2,681 at 65 (Medicare age), and $3,836 at 70. I also have a pension, and a 401K. There is an incentive to work longer, but I don’t need to. Most of the people I work with retire around 65.
What’s twice as much as $0?
should it be 70? fuck no. its goin the wrong direction thanks to rampant, unrestrained capitalism and lack of taxes.
that said, the last thing im thinkin is ‘i hope i get all mine’
no one is askin if the military will get funded… there actually isnt much difference here
You can start collecting at 62 and get 70% of your computed payout, which I will be doing.
The math is too hard for me given inflation and all that, but since social security rarely seems to have enough money, I’d guess they’re still paying out more than they take in…?
I don’t think there is an earlier option for less money
Sure there is, go to the SSA website itself the earliest eligibility is 62
https://www.ssa.gov/retirement/eligibility
You can also register yourself there & see your own estimates based on when you expect to claim social security.
I expect the issue will need to get addressed in the future, especially as the wave of millennials retiring will be far worse than the boomer wave.
I wouldn’t be surprised if it gets combined with a change in qualification age for Medicare. You push Social Security age qualifications up but push Medicare down to put the added healthcare costs on the Federal Government instead of the states. It would likely involve a slow ratchet up rather than an immediate jump. I can also see the deal include ditching the social security tax cap, or maybe adding a new tier.
Social security never made any sense to me anyway. Why not just make the economy healthy so that people can save into old age? Perhaps invest a little into financial literacy so someone doesn’t blow all their savings in Vegas when they’re 45. It’s frustrating the the government’s like, “You can’t spend that money. We don’t think you’re smart enough to plan for the future, but we’re ethical enough we’ll keep it for you and return it to you when you’re old and grouchy.”
Average life expectancy at birth is 77, because of people dying along the way for various reasons. Life expectancy at 65 is 83. The average person who makes it until 65 will live until 83
The federal government is the sole issuer of currency. When the federal government spends, it credits recipients accounts with the press of a keystroke. The money is created from nowhere. When the federal government collects taxes (social security, etc) it debits the accounts of taxpayers effectively deleting that money from existence. If the government issued social security payments that exceeded the amount it collected, it would be creating money, which is one of its functions.
This is not at all how the federal reserve and treasury department work.
The fed does create money, but not directly. They control the reserve rate, which determines how much banks can lend over backed deposits, which in turn affects the amount of currency (not just physical but also digital) in circulation.
They can also issue or absord treasury notes and bonds to impact money supply, though this is fairly small compared to the first method.
Lastly, the treasury can print physical, paper or coinage money. This called “fiat currency” by the way. This, however, accounts for an even smaller portion of the moneg supply than bonds.
In short, the government cannot, does not, and will not simply “create money from nowhere.”
Please avoid posting false information.
Federal Reserve Bank Chairman Ben Bernanke says that money is spent by the federal government simply by changing numbers in bank accounts.
"For further support we can just listen to Federal Reserve Bank Chairman Ben Bernanke. When asked “Is that tax money that the Fed is spending?” he replied, “ It’s not tax money. The banks have accounts with the Fed, much the same way that you have an account in a commercial bank. So, to lend to a bank, we simply use the computer to mark up the size of the account that they have with the Fed.” Mosler says, “the Chairman of the Federal Reserve Bank is telling us in plain English that they give out money (spend and lend) simply by changing numbers in bank accounts. There is no such thing as having to ‘get’ taxes (or borrow) to make a spreadsheet entry that we call ‘government spending’.”
It is that simple. How does the government spend? “Keystrokes,” says Wray. The money does not come from anywhere, it is created by the currency-issuer. Thus, taxing and spending are functionally two completely separate operations. The government issues the money with a few keystrokes at the Fed first, and then it taxes, removing some from circulation."
https://medium.com/@nicholasadiaz7/on-the-role-of-taxes-mmt-707fb4b3b80b
When the government approves civil projects such as infrastructure projects, the payments are considered issuing of currency according to modern monetary theory.
From Wikipedia regarding governments with Fiat currency: “When a government spends money, its treasury credits its operating account at its central bank and deposits this money into private bank accounts. This money increases the total deposits in the commercial bank sector.”
Social security is a Ponzi scheme. Every Ponzi scheme has an end. The Fed has been able to keep it going longer than normal by “printing” money, but it can’t do that forever. We are just now starting to see the beginning pangs of inflations. It will inevitably get worse.
I thought it was funded by taxing the working people to fund retiring people? Is there currently a shortfall?